
Beyond Salesforce Reporting: Meet the Squivr Analytics Suite

Revenue teams do not have a data problem. They have a problem turning all of that data into something useful.
Salesforce contains an enormous amount of information about accounts, opportunities, contacts, relationships, activities, pipeline, revenue, and account plans. But even with all of that information available, teams still spend too much time exporting data into spreadsheets, building disconnected reports, or moving between different tools to understand what is actually happening across their business.
Our upcoming release of Squivr Analytics is designed to change that.
Squivr Analytics brings data exploration, reporting, visualization, and scoring together directly within Salesforce. The goal is to help revenue teams move beyond simply collecting data and start using it to better understand their customers, prioritize opportunities, identify risk, and determine where to take action.
The initial Squivr Analytics offering will include three major capabilities: Squivr Grid, Squivr Reports & Dashboards, and Squivr Scoring. Together, they create an analytics layer designed specifically around the way modern revenue teams operate.
Squivr Grid: A Better Way to Work With Salesforce Data
Salesforce is incredibly powerful, but working across large sets of records can still be cumbersome. That often leads teams back to spreadsheets whenever they need to quickly analyze, organize, compare, or update information.
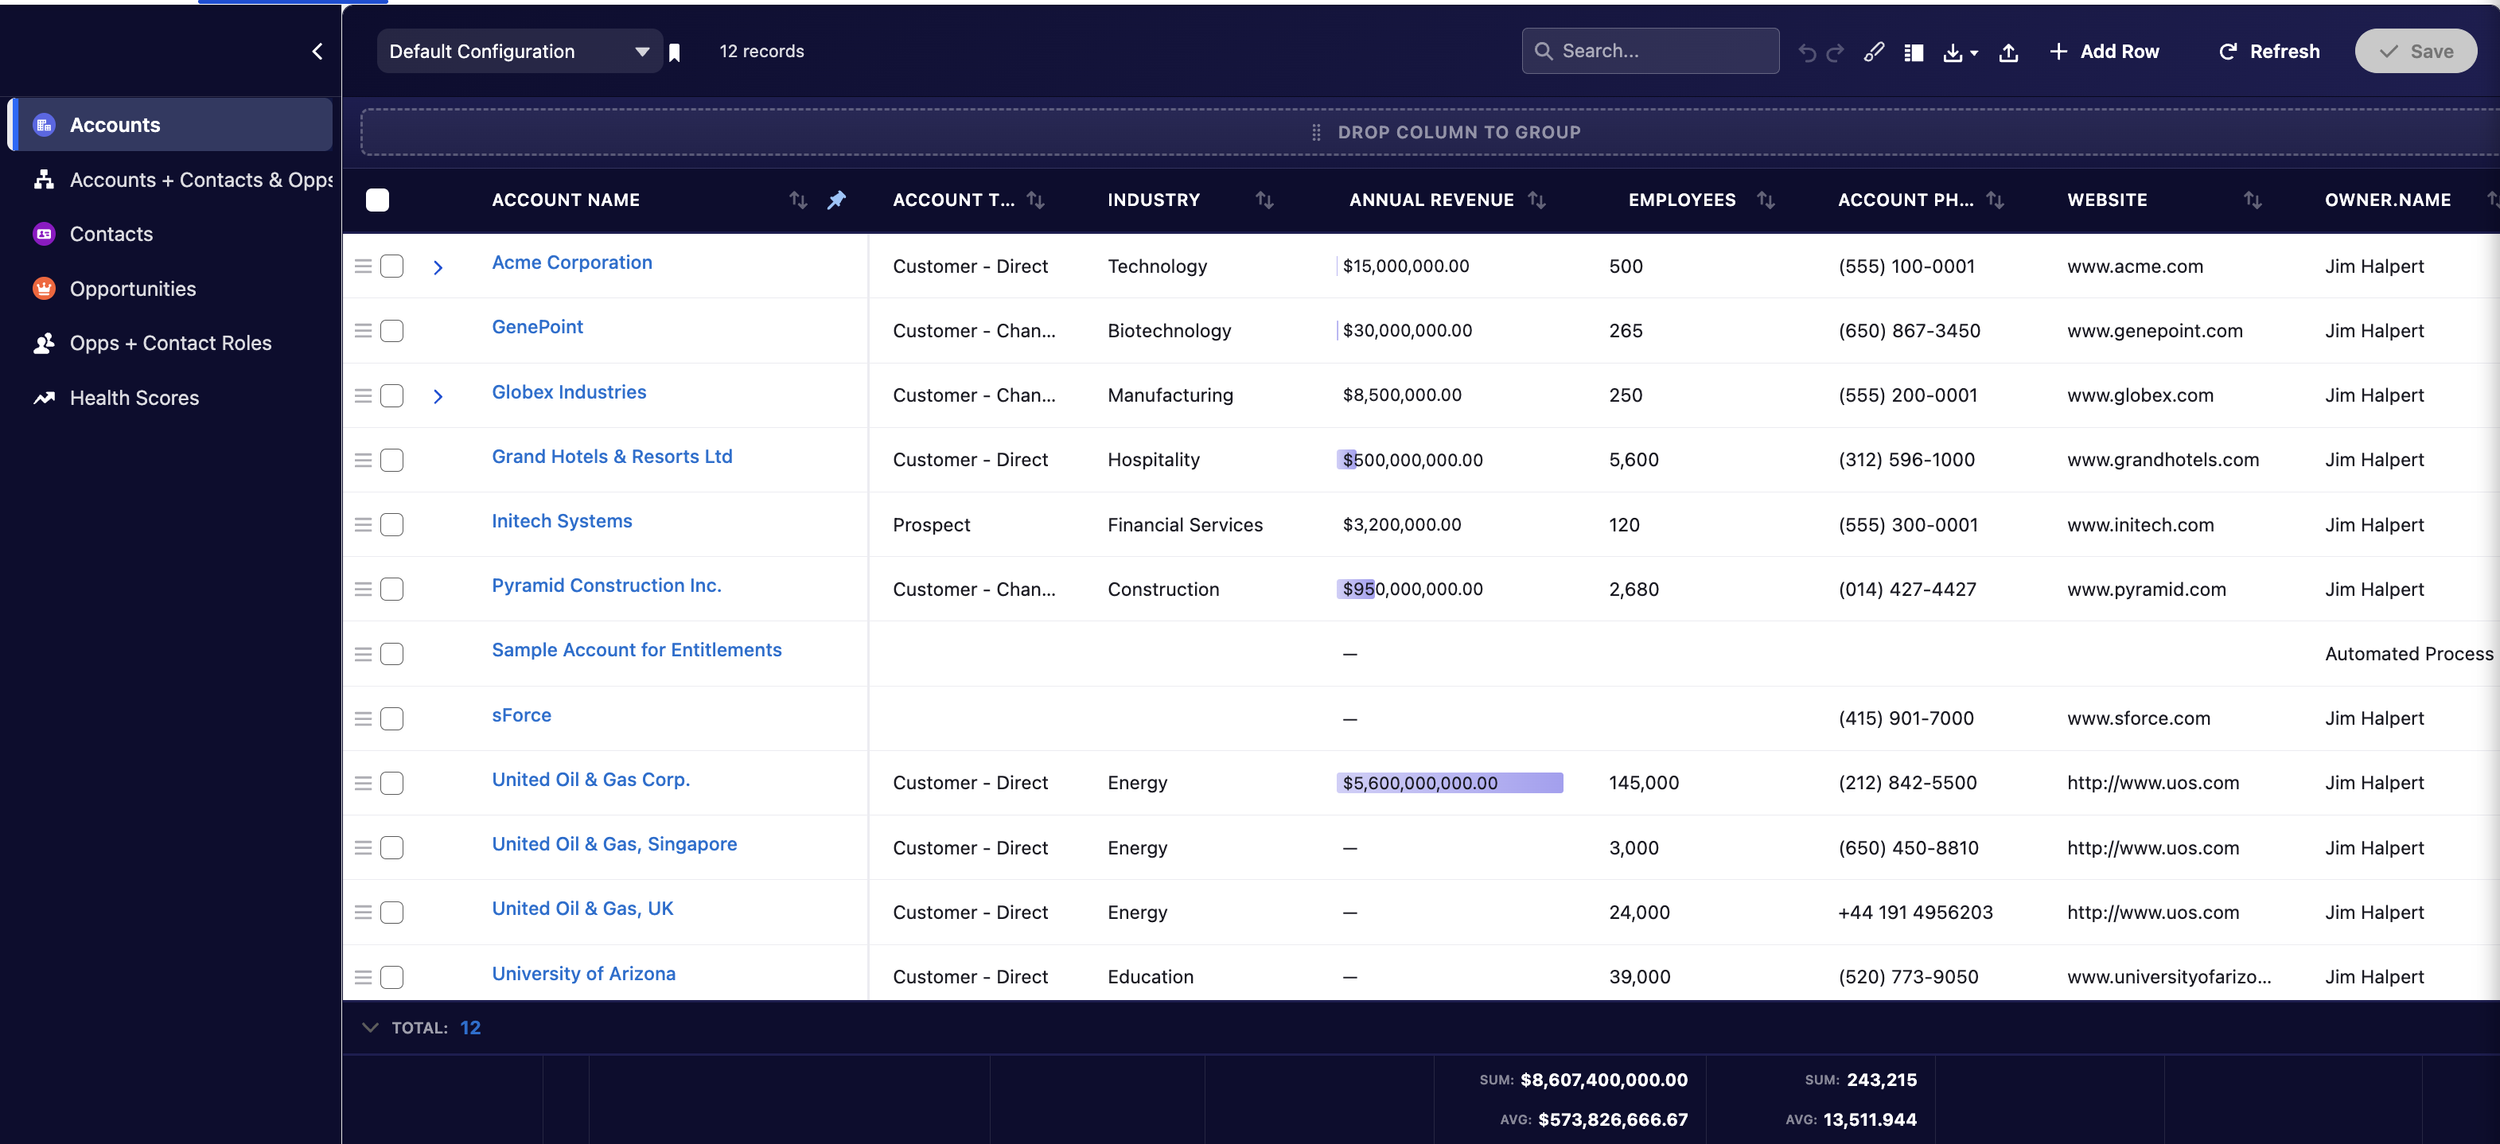
Squivr Grid brings a modern, spreadsheet-style experience directly into Salesforce. Users can create configurable views across Accounts, Contacts, Opportunities, Contact Roles, and other Salesforce objects while maintaining the structure and relationships between those records.
Teams will be able to search, filter, sort, group, organize, and work with Salesforce data from a much more flexible interface. Grid is also being designed to support capabilities such as inline editing, mass updates, hierarchical data, configurable columns, saved views, aggregations, conditional formatting, and other tools that make large datasets easier to understand and manage.
The concept is straightforward: give users the flexibility they love about spreadsheets without requiring them to leave Salesforce.
A sales leader might use Grid to analyze an entire book of business. An account manager might use it to understand a global account hierarchy and the opportunities and contacts underneath it. RevOps might build purpose-specific configurations for different teams. A rep might simply use it to identify the accounts requiring attention and make updates quickly.
The data stays in Salesforce, and more importantly, so does the work.
Squivr Reports & Dashboards: See the Entire Revenue Lifecycle
Reporting is another area where we believe there is an opportunity to rethink the traditional Salesforce experience.
Most revenue organizations already have reports for pipeline, opportunities, forecasts, activities, and revenue. Those are important, but they only tell part of the story.
Squivr Reports & Dashboards is being designed to connect traditional revenue metrics with the underlying behaviors and signals that help explain those results.
Teams will be able to analyze pipeline, forecasting, revenue, opportunities, accounts, leads, activities, and rep performance alongside Account Planning, Relationship Intelligence, stakeholder coverage, buying committees, multi-threading, action plan execution, whitespace, expansion potential, contact engagement, and Squivr adoption.
That allows organizations to start asking much more interesting questions about their business.
Do our largest opportunities have executive relationships? Are we truly multi-threaded within our strategic accounts? Which accounts have strong pipeline but weak stakeholder coverage? Where do we have whitespace within existing customers? Which account plans are falling behind? Are teams completing the milestones they committed to? Which relationships are becoming stronger, and which ones are going quiet?
These are the questions that connect CRM data to actual revenue execution.
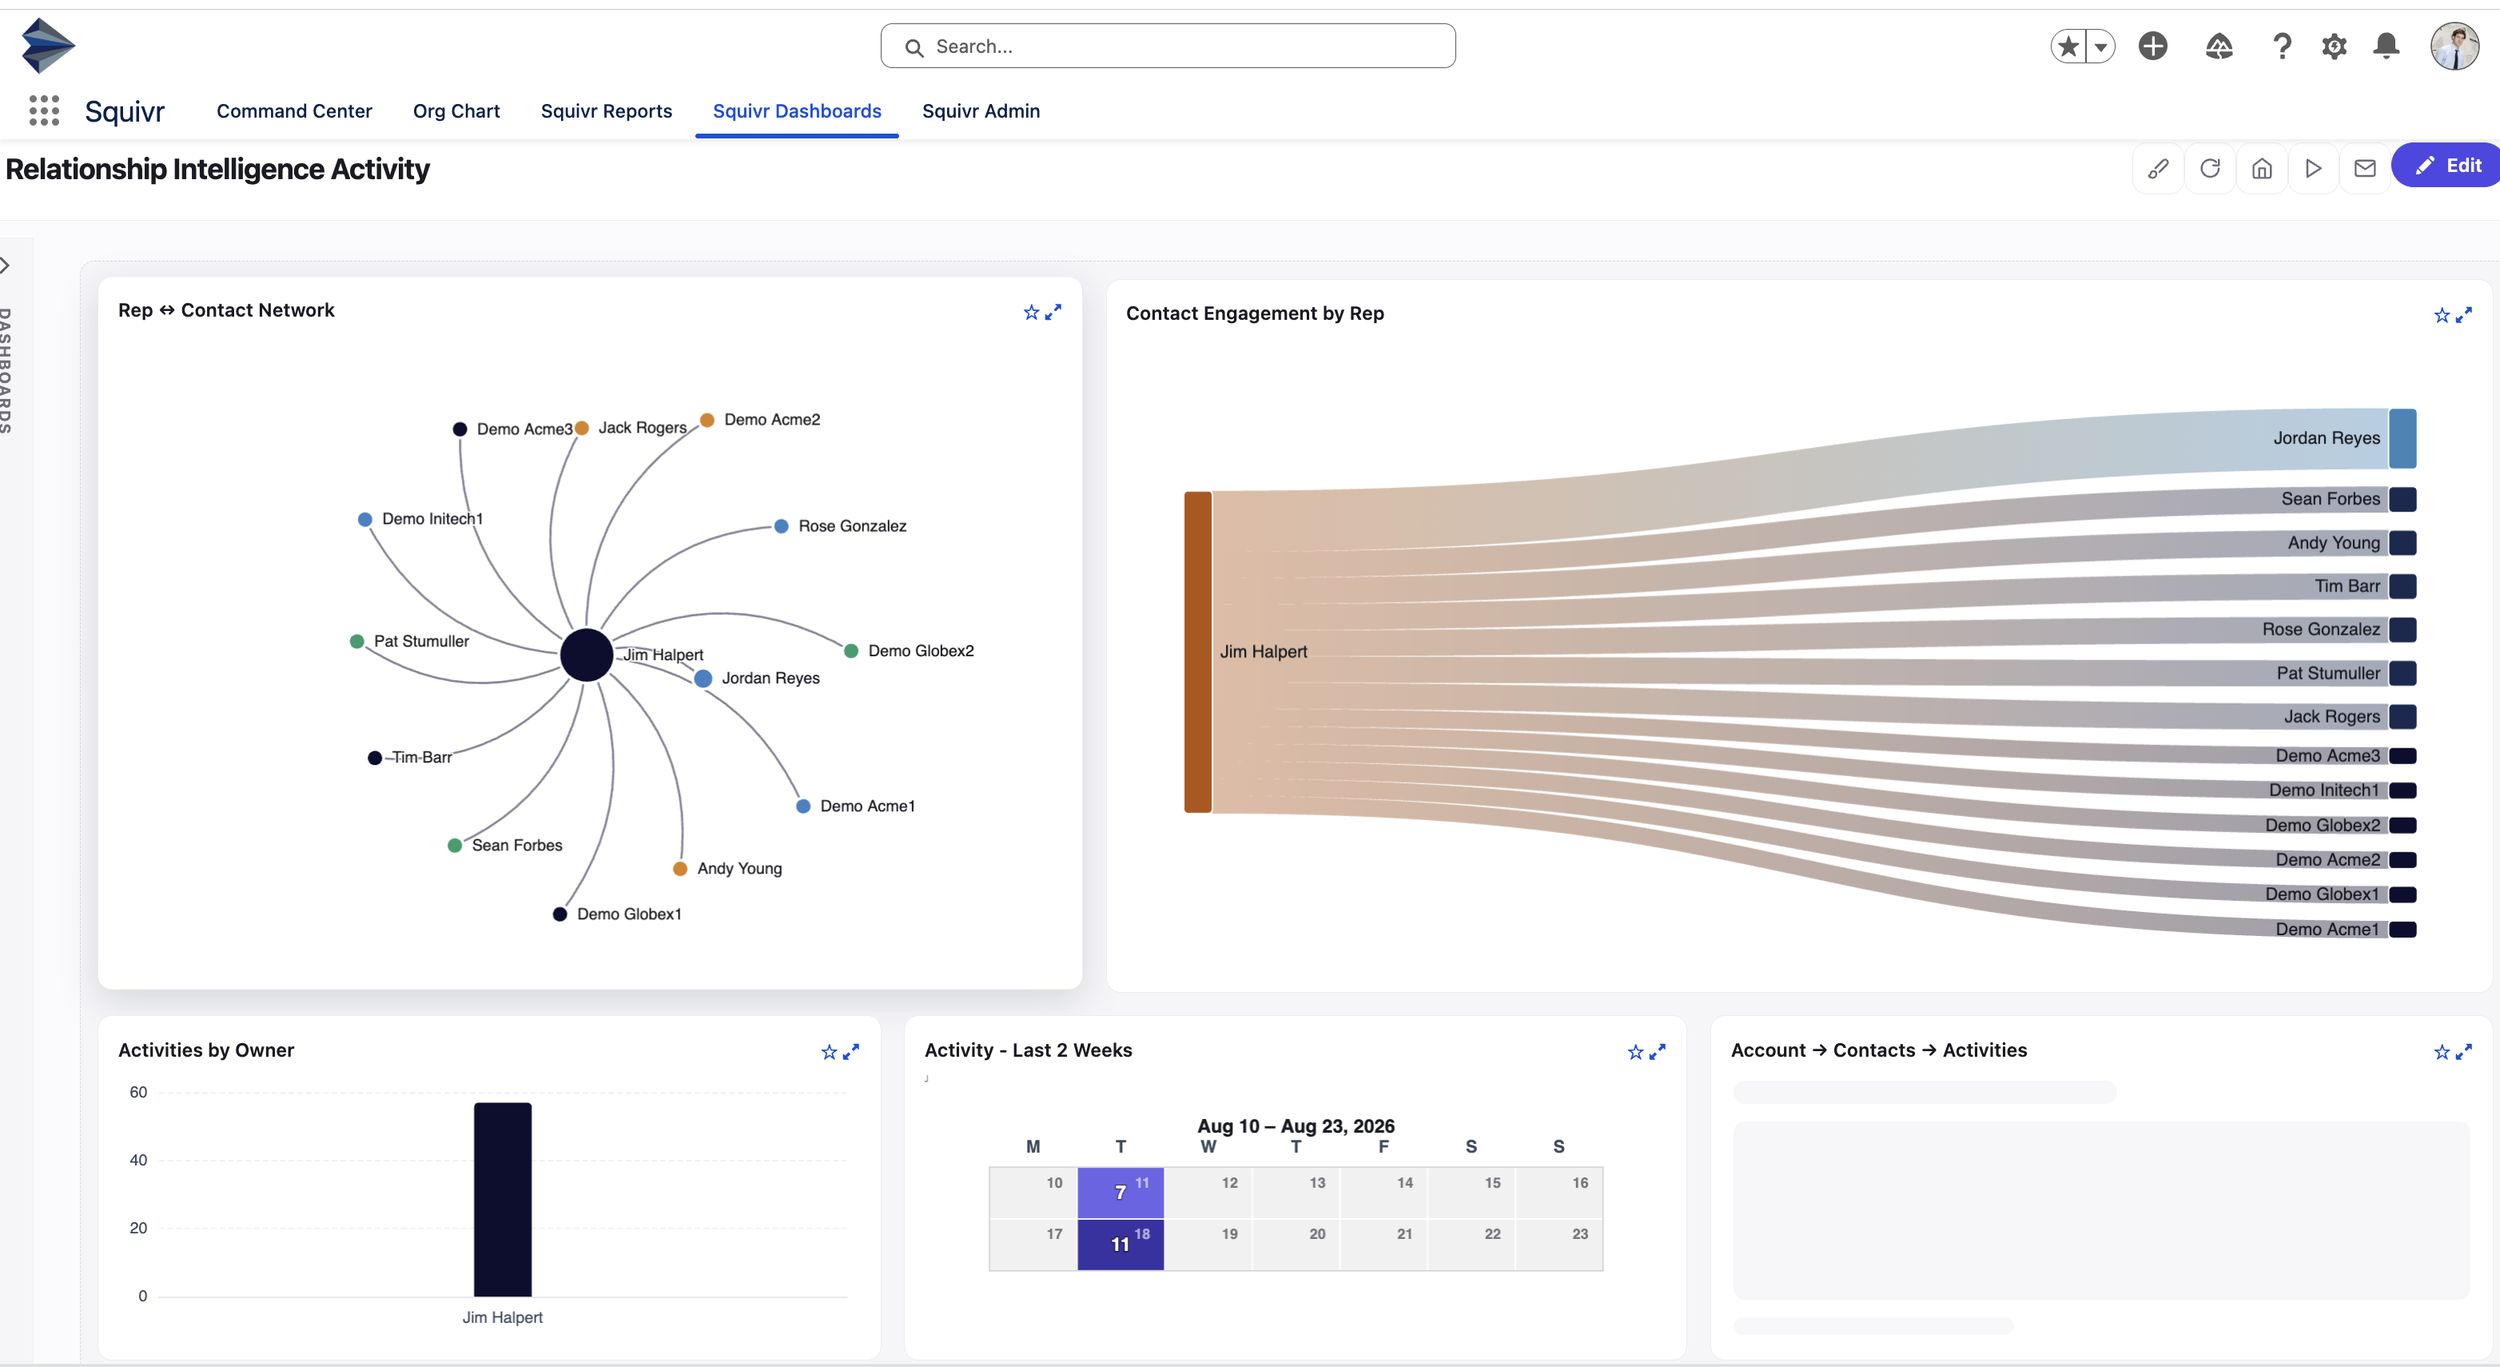
Squivr Reports & Dashboards will also introduce richer ways to visualize this information. Rather than forcing every question into the same traditional chart, teams can use tables, gauges, bar charts, line charts, heatmaps, relationship networks, flows, and other visualizations to better understand what is happening.
For example, a Relationship Intelligence dashboard can visualize the network between sellers and customer stakeholders while also showing engagement, activity, and relationship coverage. An Account Planning dashboard can surface active plans, completion percentages, overdue milestones, plan velocity, and template adoption. A Whitespace dashboard can show current revenue, total potential, expansion pipeline, and opportunities across an entire account hierarchy.
The objective is not to create more dashboards. It is to create better visibility into the things that actually drive revenue.
Squivr Scoring: Define What Good Looks Like
The third major component of Squivr Analytics is Squivr Scoring, and this is where analytics can become significantly more actionable.
Every organization has a different definition of a healthy account, a qualified opportunity, a strategic relationship, or a successful account plan. Your scoring methodology should reflect that.
Squivr Scoring will allow organizations to define their own scoring mechanisms using the Salesforce data and signals that matter to their business. Instead of relying on an unexplained black-box score, teams can determine what should be measured, how important each component is, and how those components contribute to an overall score.
An Account Health Score, for example, might consider Executive Coverage, Stakeholder Breadth, Relationship Quality, Open Pipeline, and Engagement Recency. One organization might place significant weight on executive relationships, while another might prioritize pipeline creation, account plan execution, customer engagement, whitespace penetration, or another combination of factors.
The important part is that the score reflects your revenue strategy, not someone else's definition of what good looks like.
We also believe scoring should be explainable.
If an account receives a score of 60, a seller should not have to wonder where that number came from. Squivr can show what contributed to those 60 points, what prevented the account from earning the remaining 40, and which component is having the greatest impact.
Instead of simply telling a rep that an account has a health score of 60, Squivr might identify that Executive Coverage is the biggest drag because no senior stakeholder is currently mapped to the account.
Now the score is not just a number. It is something the seller can act on.
That transparency also makes scoring more valuable across the organization. Reps can understand where to focus. Managers can identify risk and coaching opportunities. Revenue leaders can compare account health across the business. RevOps can define, manage, and evolve scoring models as the company's GTM strategy changes.
Connecting the Signals That Drive Revenue
The bigger vision behind Squivr Analytics is to connect information that revenue organizations have traditionally analyzed separately.
Pipeline tells you part of the story. Relationships tell you another. Account plans add additional context. Activities, stakeholder engagement, whitespace, opportunity progression, and execution each contribute another piece.
When those signals are brought together, you can start to see the complete picture.
Imagine an account with significant revenue potential and whitespace. There is an active opportunity, but executive coverage is weak. The seller is only connected to a small portion of the buying committee. Engagement has been declining, and several milestones within the account plan are overdue.
Looking only at pipeline might suggest the account is healthy.
Looking across all of those signals tells a very different story.
That is where we believe revenue analytics needs to go.
From System of Record to System of Intelligence
Salesforce has long been the system of record for revenue organizations. We believe the next opportunity is helping teams turn that system of record into a system of intelligence and action.
Squivr Analytics extends our broader vision for Account Planning and Relationship Intelligence by bringing data, relationships, planning, analytics, and execution together.
With Squivr Grid, teams can explore and work with their Salesforce data in new ways. With Squivr Reports & Dashboards, they can visualize performance and uncover patterns across the revenue lifecycle. With Squivr Scoring, they can define what matters, measure it consistently, understand what is driving the result, and identify where to take action.
Ultimately, Squivr Analytics is about turning Salesforce data into action.
Revenue teams already have the data. What they need is a better way to connect it, understand it, and use it to make smarter decisions. Squivr Analytics brings those signals together so teams can see where they stand, understand what is driving the business, identify what needs attention, and act.
See the business. Understand the signals. Take action.
That is what we are building with Squivr Analytics.